

Network
Every request the app makes, searchable, replayable and throttled, in-app browser traffic included.
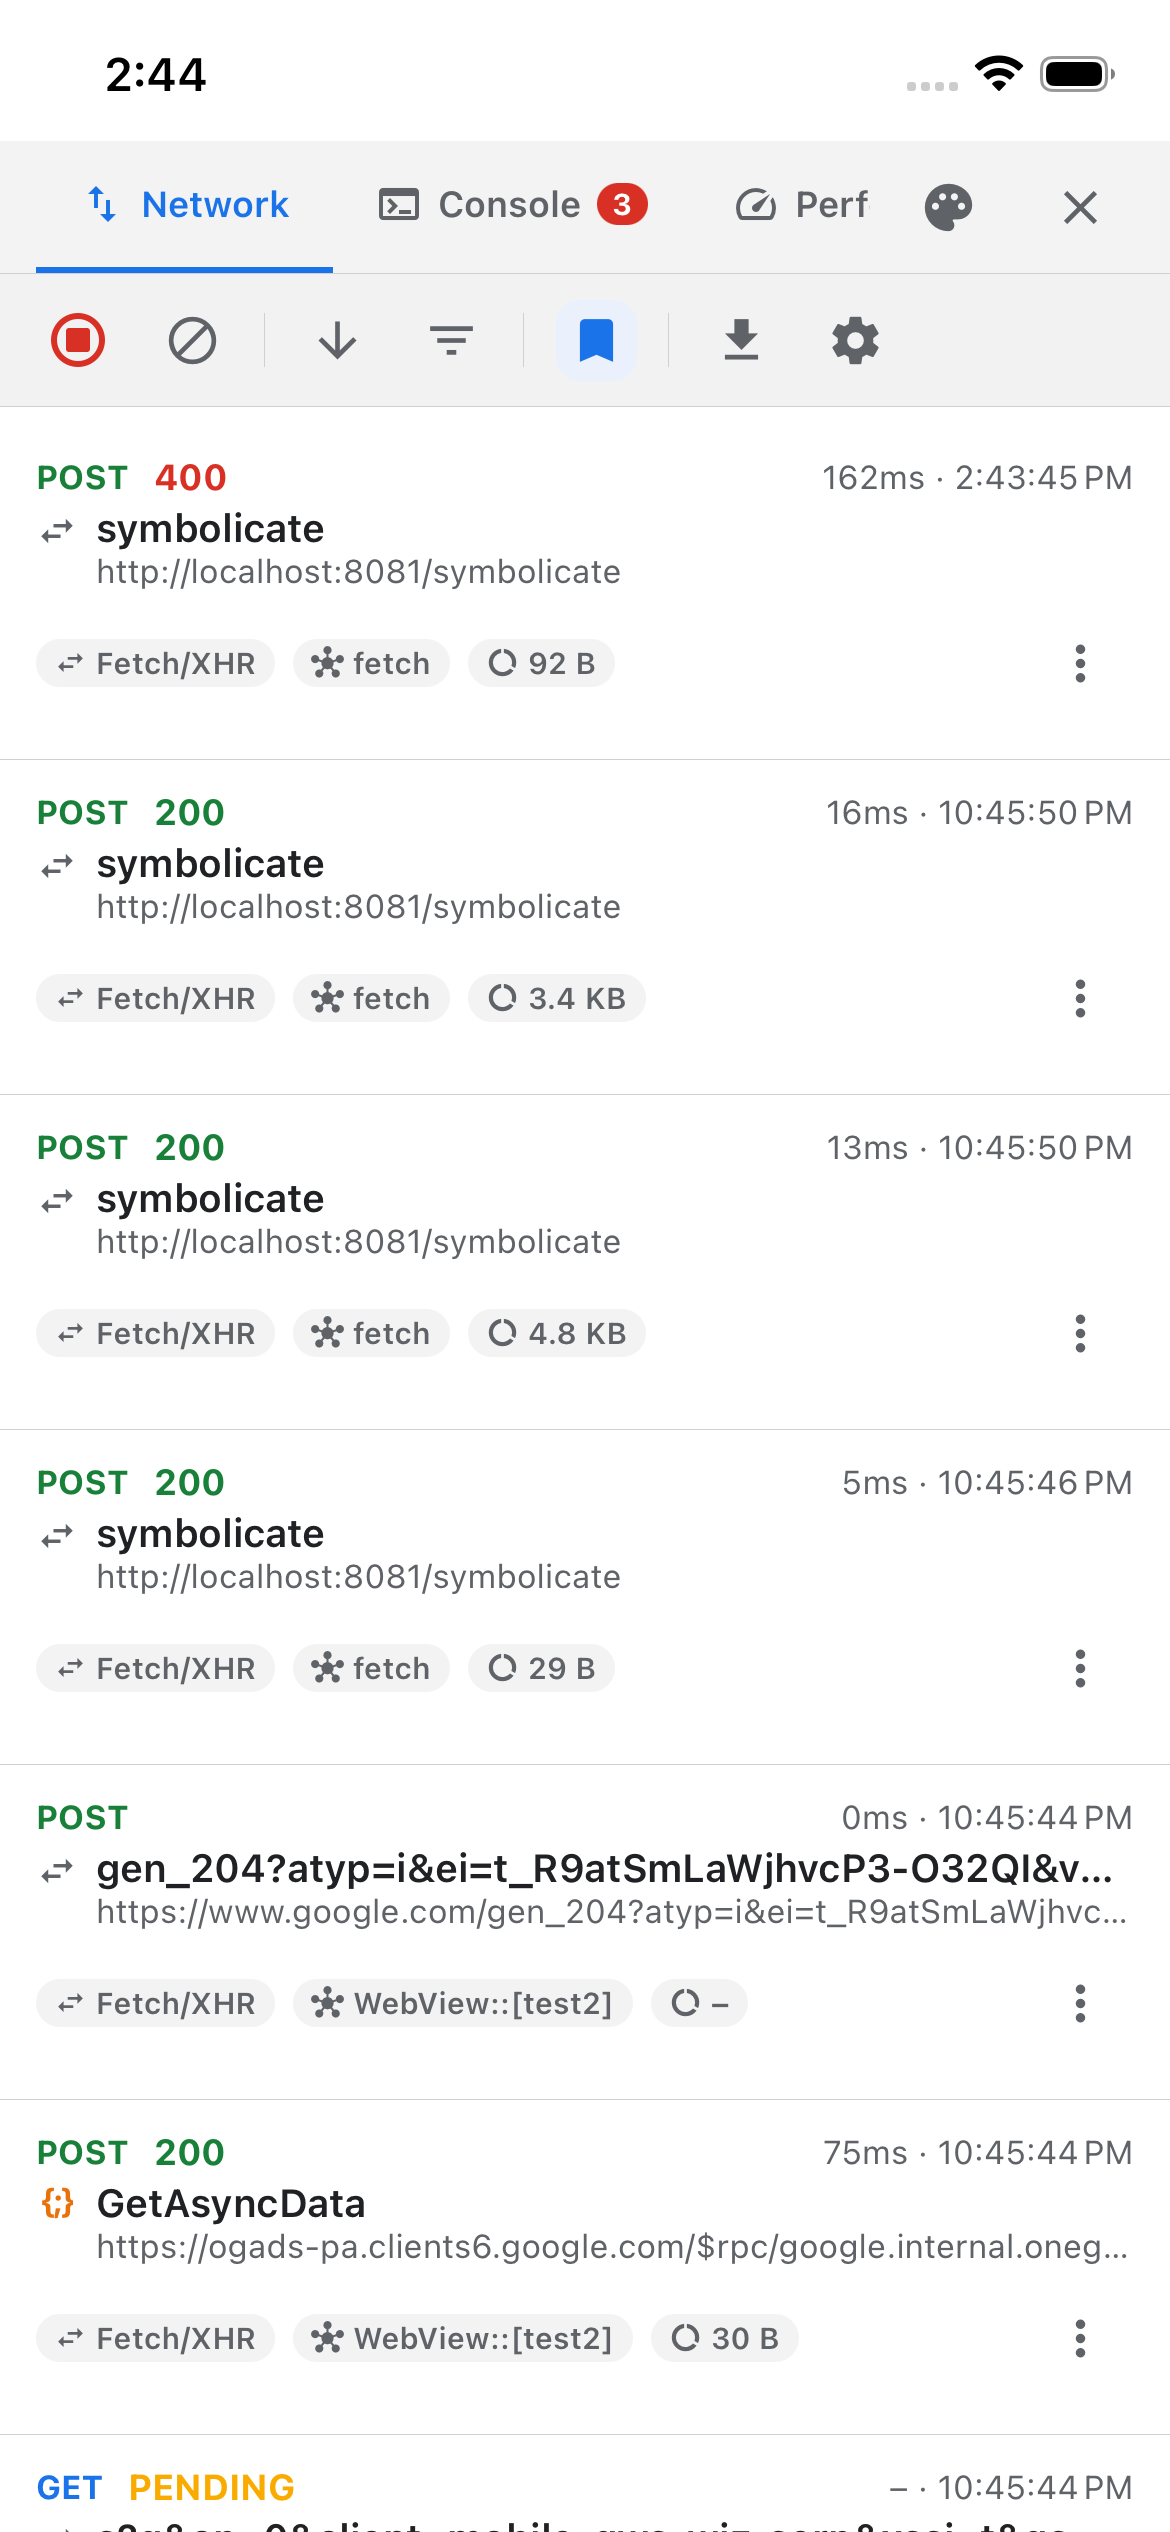
The Network tab records every request your app makes and shows each one as a row.
A row carries the method, the status, how long it took and when it started. Underneath sit the short name and the full URL, plus badges for the kind of response, where the request came from and how big it was. A request still in flight shows in amber how far its body has got, or PENDING before anything has arrived, so you can tell "waiting" from "finished". An open event stream says STREAM.
Four capture paths feed one list: fetch, XMLHttpRequest (which is what catches axios and most
HTTP client libraries), react-native-nitro-fetch if your app uses it, and any <WebView /> you
wired up. WebSocket connections and server-sent event streams land in the same list. Nothing needs
configuring: the tab records from launch.
Finding one request among hundreds
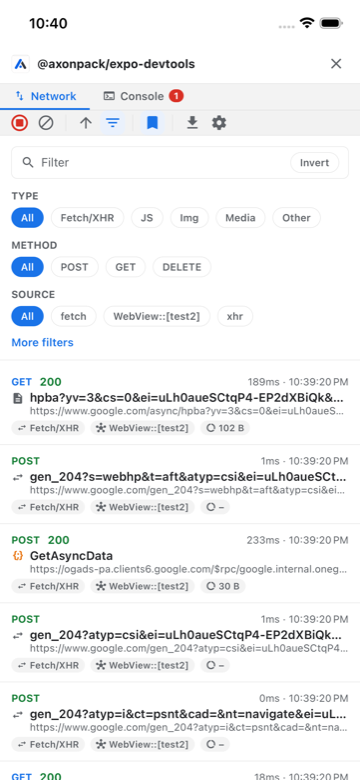
Search the text, then narrow with the chips: type (Fetch/XHR, JS, Img, Media, Other), status (2xx, 4xx, Failed, Pending), method, or source. The status, method and source chips are built from what you have actually captured, so they only ever offer real options, and method and source take more than one at a time, so you can put two clients side by side, or GET and POST together.
Status also takes an expression when a band is not the question: >= 400, 200-299, or one exact
code. Search matches light up in the list, and the box carries the three switches you expect from an
editor: match case, whole word and regex. Invert flips the whole filter (every chip,
not just the text), except the two Hide switches. Clear resets all of it in one press.
Under More filters: a size and a duration range (20kb, 1.5s, the units you would say out
loud), show only what is still in flight, show only what one of your override rules answered, and the
toggles that hide data URLs or failed requests.
Testing a bad connection
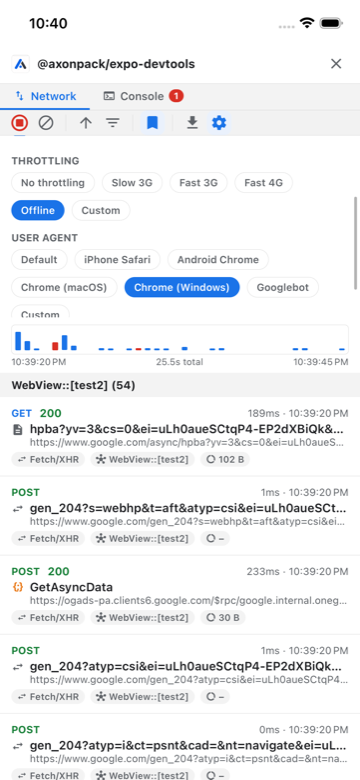
Pick Slow 3G, Fast 3G, Fast 4G, Offline, or set your own speed and delay. It applies immediately, to your app's own requests and to in-app browser pages. You can also pretend to be an iPhone, an Android phone, a desktop browser, or Googlebot.
Every captured request remembers the settings it ran under, so requests from before and after a change stay easy to tell apart. The exact profiles are in the Network tab reference.
Reading the room
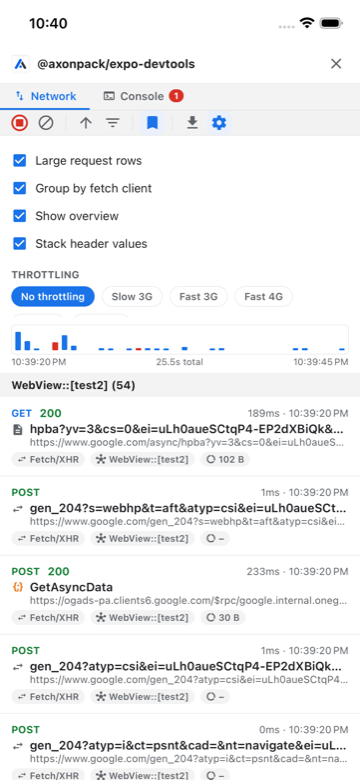
Turn on the traffic graph to see request volume over time, and tap a section to zoom the list to that moment. Turn on grouping to bundle rows by where they came from, with a count per group. Or switch to compact rows to fit more on screen.
Sort by time, size, duration or status. The arrow in the toolbar flips the direction and says what pressing it would give you, so "which one is slow" is one tap rather than a read through two hundred rows.
Tapping a request
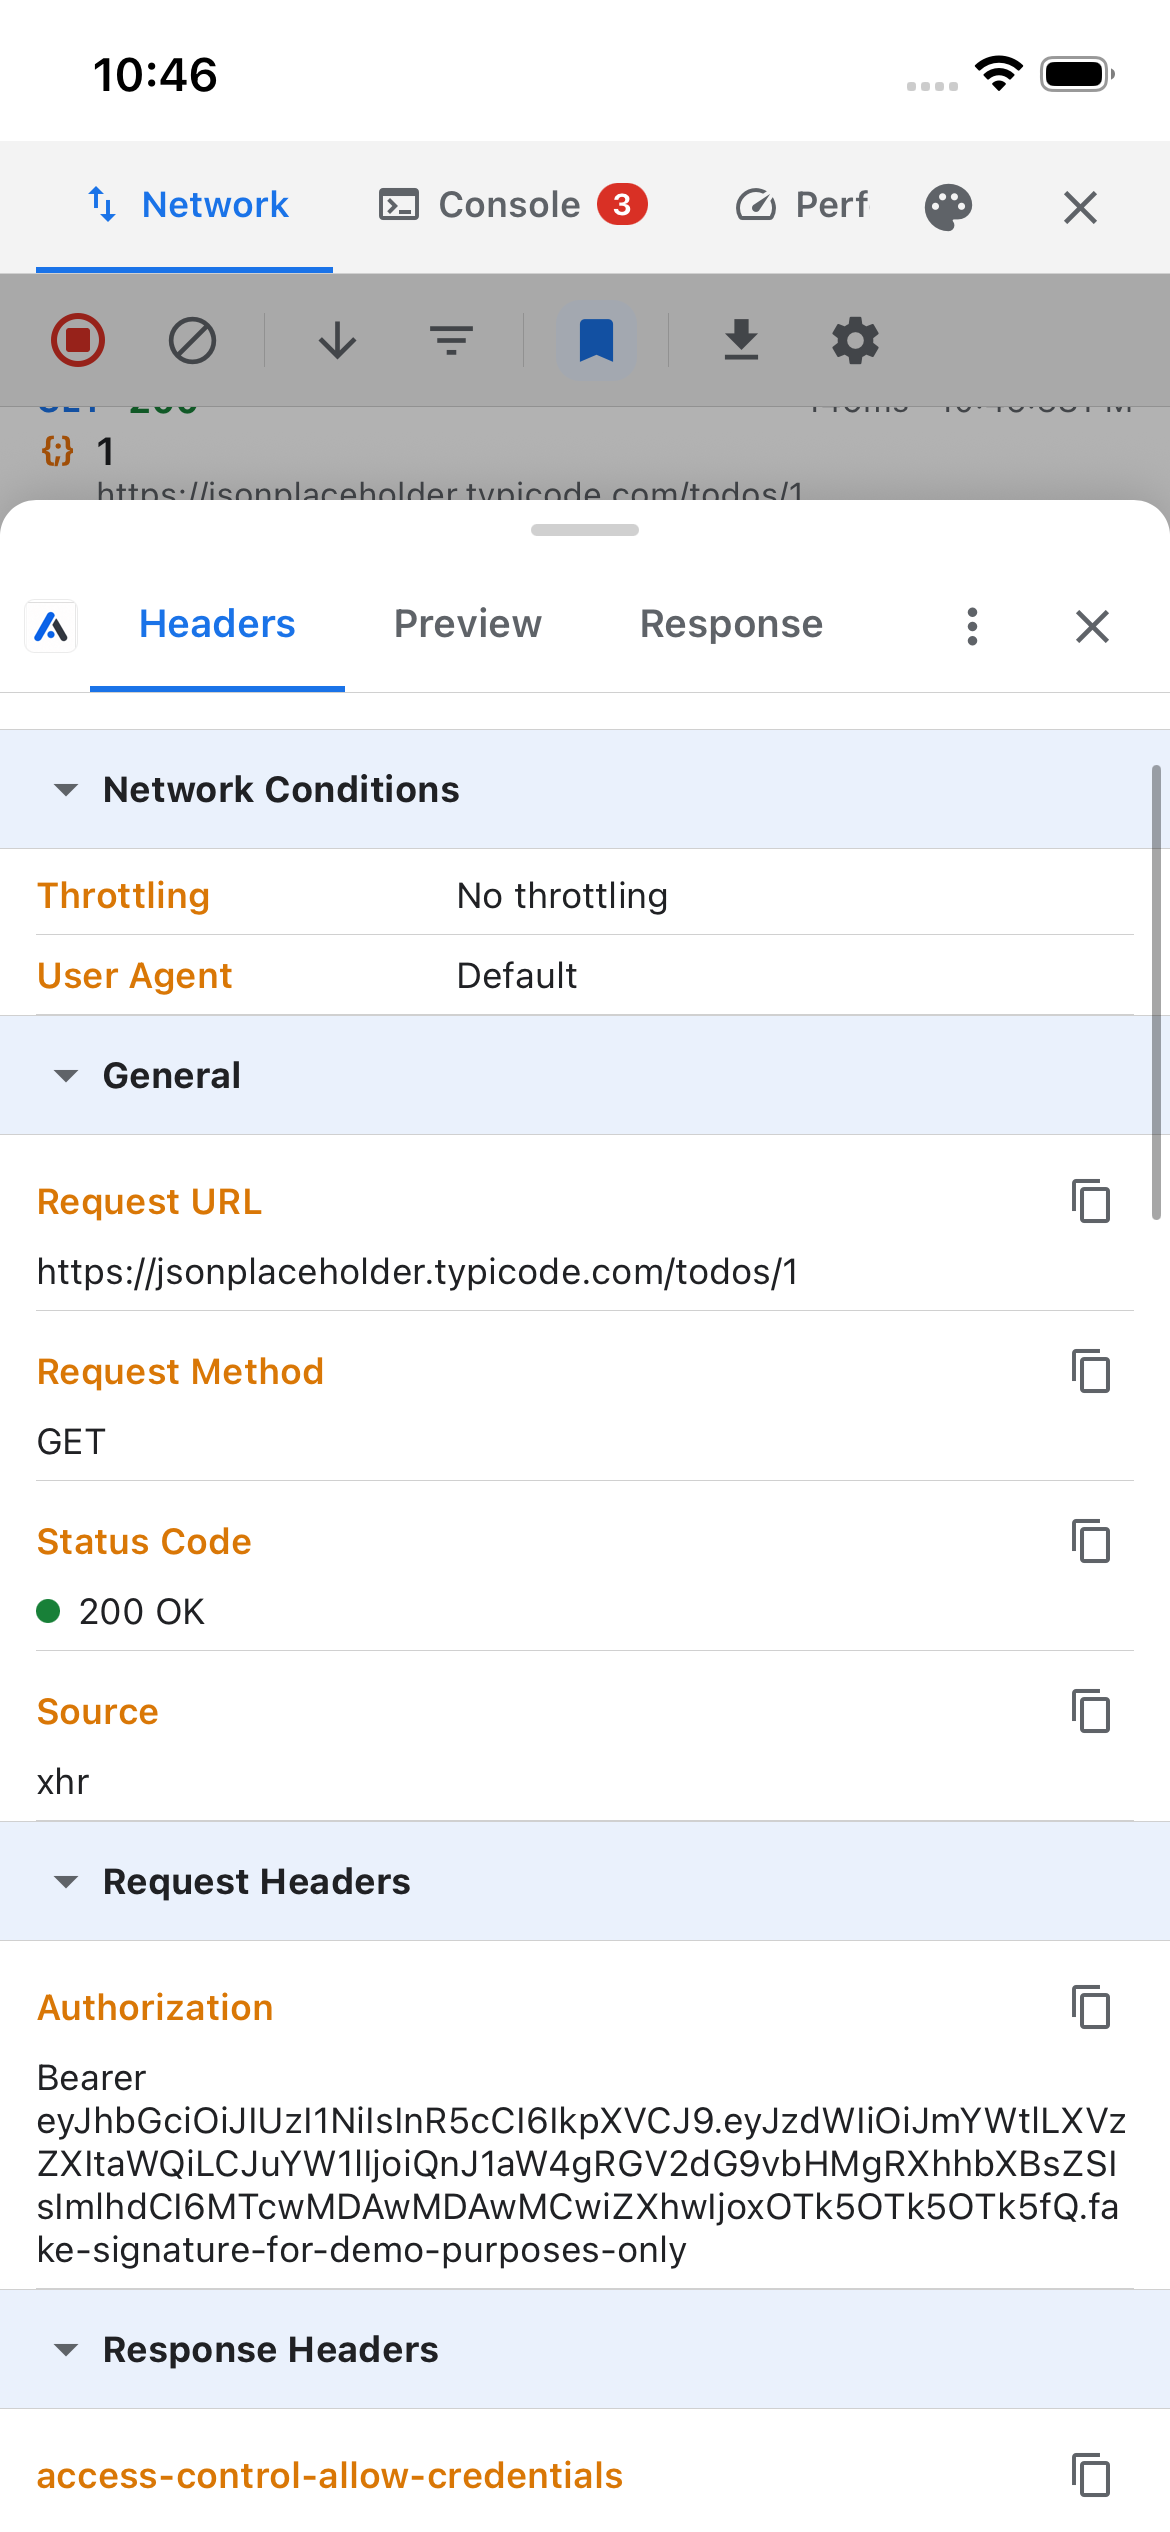
A panel slides up with everything captured, across a few tabs:
- Headers: what was sent and what came back, each value with its own copy button, plus the connection settings this request ran under and the response size.
- Payload: what you sent. JSON is an explorable tree rather than a wall of text, and a form upload lists each field and file.
- Preview: the response pretty-printed and colour-coded. Images and HTML render as a real preview.
- Response: the raw body, in full, never cut off.
- Timing: a waterfall of the phases inside the request, queued through DNS, TCP, TLS, sending, waiting and downloading, plus the protocol that was negotiated and whether the connection was reused. The phases come from the platform's own networking stack, so a request that went out some other way falls back to time-to-headers and body download, and the tab says which of the two you are reading.
- Cookies: what the request sent and what the response set, with each cookie's attributes.
- Initiator: the call stack that made the request, symbolicated against the dev server so the frames name your own files.
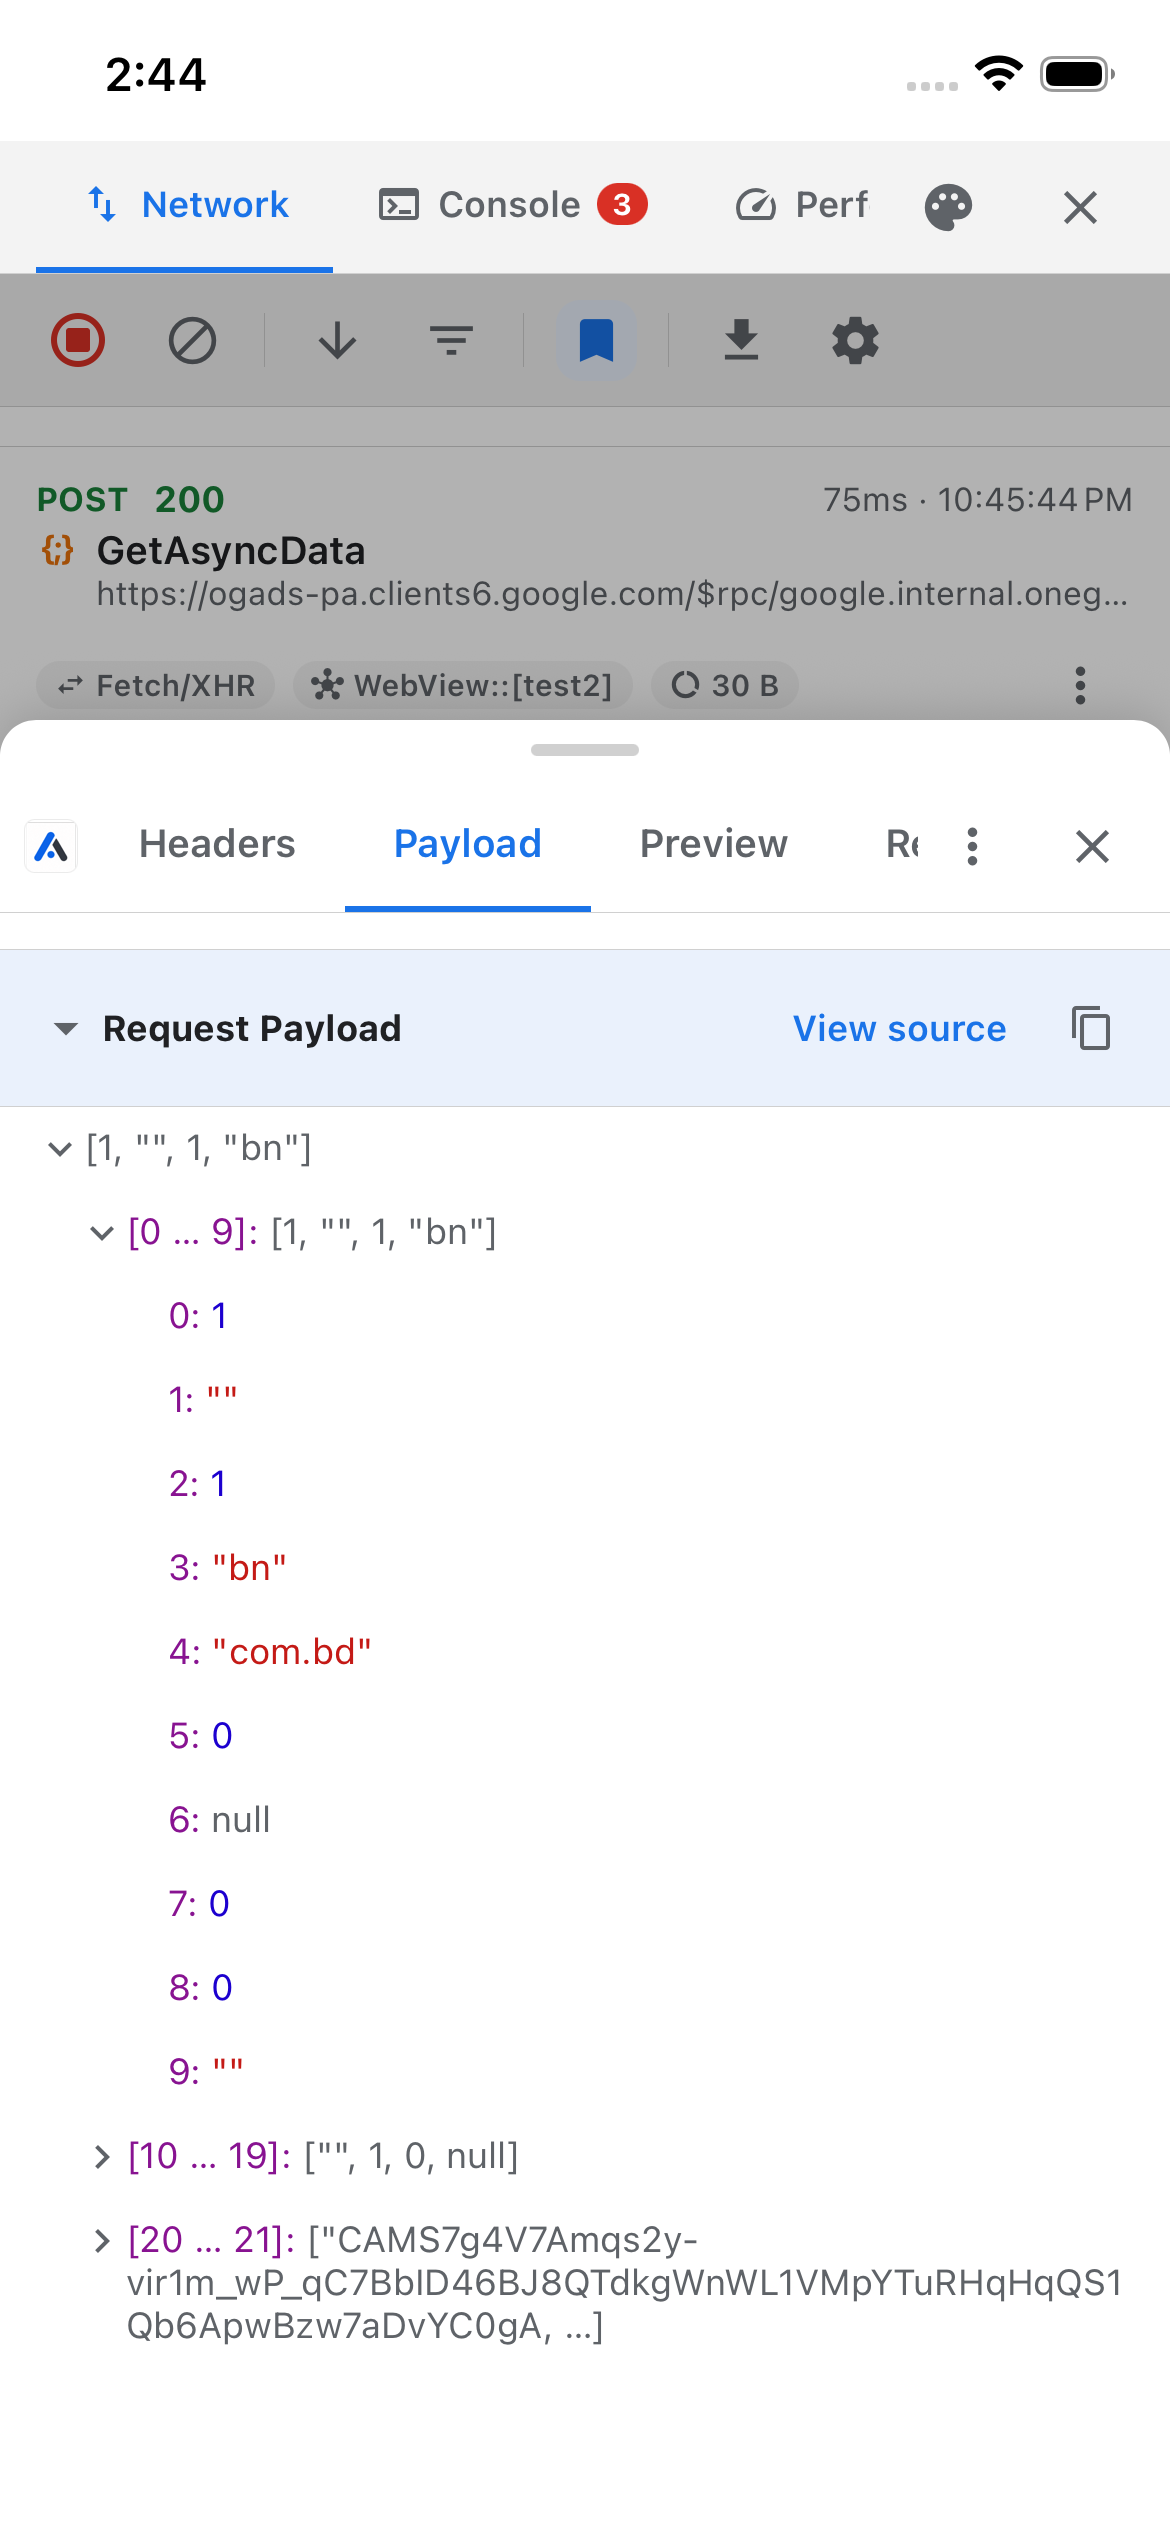
Payload, Preview and Response share a search box that stays put while the body scrolls, with the same match case / whole word / regex switches. Every hit is highlighted where it sits: in the JSON tree, in the syntax-coloured code, and in the raw body alike. A body over 50,000 characters is too large to search, and the tab says so.
The ⋮ menu copies the URL, or the whole request as a ready-to-paste cURL command or fetch
snippet.
Sockets and streams
A WebSocket is a row in the same list, marked WS, coloured by its lifecycle rather than by a status
code it does not have: connecting, open, closing, closed or error. The row carries the frame count,
and the close code once it has one. Tap it and the sheet is the message log, newest at the bottom,
each frame marked with the direction it went, binary frames flagged as BIN. It keeps filling while
you watch, because the socket is still open.
A server-sent event stream stays an HTTP row, since that is what it is, and grows an Events tab
in its detail sheet: one row per dispatched event with its type, its id when the stream sent one,
and its data pretty-printed.
Turn either off with network: { websocket: false } or network: { sse: false }. With sse off the
app's own stream is still recognised as a stream, because its endless body has to be, so the row stays
and only the events are dropped.
Editing and resending a request
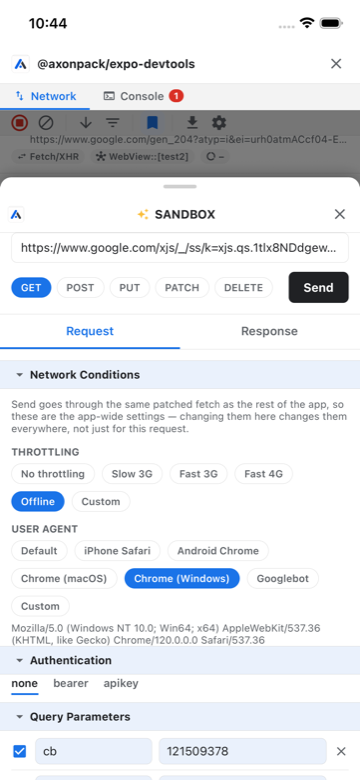
Try in sandbox opens the request as something you can edit: change the method, the URL, the query parameters, headers, cookies, auth, or the body, then Send and watch the real response come back. Handy for "does this break if the token is missing?" without touching your code.
Sandbox requests go out through the same patched fetch, so they appear in the log like any other
request.
Blocking a URL, or faking the answer
The ⋮ menu on a row also carries two ways to answer a request yourself:
- Block this URL fails it before it goes out, which is how you find out what your screen does when one call never lands. The same item turns into Stop blocking this URL.
- Override response… opens an editor seeded with what the server actually said, so you change a response rather than type one from scratch. Set the status, the content type and the body, and every later request to that URL gets your answer instead.
Rules are keyed by the whole URL, not a pattern, so one can never match more than you meant. A row a rule answered is badged Blocked here or Overridden here in the list, so it never reads as one of the server's own replies, and the filter panel's Only overridden or blocked narrows to them.
Rules live in memory for the session, and are gone on the next launch.
Taking it with you
Export opens the OS share sheet with the currently-filtered list as JSON, named
network-log-<timestamp>.json. Mail it to yourself, drop it in Slack, paste it into a bug report. It
uses React Native's own Share and nothing else, so there is no filesystem involved and no extra
dependency.
Redaction
The tab keeps every request in full, and that includes the token in an authorization header. Two
options in the provider's network config keep a secret out of it:
<DevtoolsProvider
  config={{
    enabled: __DEV__,
    network: {
      redactHeaders: ['authorization', 'cookie', 'set-cookie'],
      redact: (entry) => ({
        ...entry,
        url: entry.url.replace(/token=[^&]+/, 'token=[redacted]'),
      }),
    },
  }}
>
  <App />
</DevtoolsProvider>redactHeadersreplaces the value of each listed header with[redacted], in the request and in the response. Names match without regard to case. The list is empty by default, so nothing is redacted until you name it.- While
cookieis on the list, a WebView page'sdocument.cookieis redacted as well. It is the same secret as the header, just read another way. redactis for everything else, such as a token in a query string or a body. It runs afterredactHeaders, so it already sees the placeholders. It runs each time an entry changes, not only once, because headers and bodies mostly arrive after the request is first recorded. Return the entry, edited or not, ornullto drop the row from the list.- If
redactthrows, the row is dropped. Keeping it after your own redaction broke could store the very value it was written to remove.
Both run before a request is stored, so nothing sees the real value: not the list, the detail sheet,
the copy menu, export, the React Native DevTools tab or crash breadcrumbs. Try in sandbox starts
from the stored request, so a replay sends [redacted] too. Type the real value back in if the
request needs it.
redact sees WebSocket rows as well as HTTP ones, told apart by kind. A socket row's URL,
protocols, close reason and error pass through it. redactHeaders covers HTTP rows only, a
server-sent event stream's own row included. Neither one sees socket frames or the events of a
stream, since those are per message and both options work on rows.
Both options are in the provider reference.
Limits
- The list holds the 1,000 most recent requests, and apart from them the 1,000 most recent sockets. Older ones fall off the end. Request and response bodies are kept in full, never truncated.
- The phase breakdown is measured by the native networking stack, so it needs a development build, and it only covers traffic that went through a stack this package hooks. Everything else keeps the two numbers JavaScript can measure on its own.
- The cookie list is read from this request's own headers. A cookie the platform's jar attached without it appearing there is not visible to the panel.
- A socket keeps its most recent 1,000 frames, and a stream its most recent 1,000 events. The message log shows every frame it holds. A stream's Events tab renders the most recent 200.
- A wired-up page can never be fully throttled: images, stylesheets and scripts the browser loads by itself still go out at full speed.